Innovative Solution
for Data Analysis
We bring the power of data science and artificial intelligence to every business


Trusted by innovative companies

Data science is a multidisciplinary field that uses scientific methods, processes, algorithms, and systems to extract knowledge and insights from data.

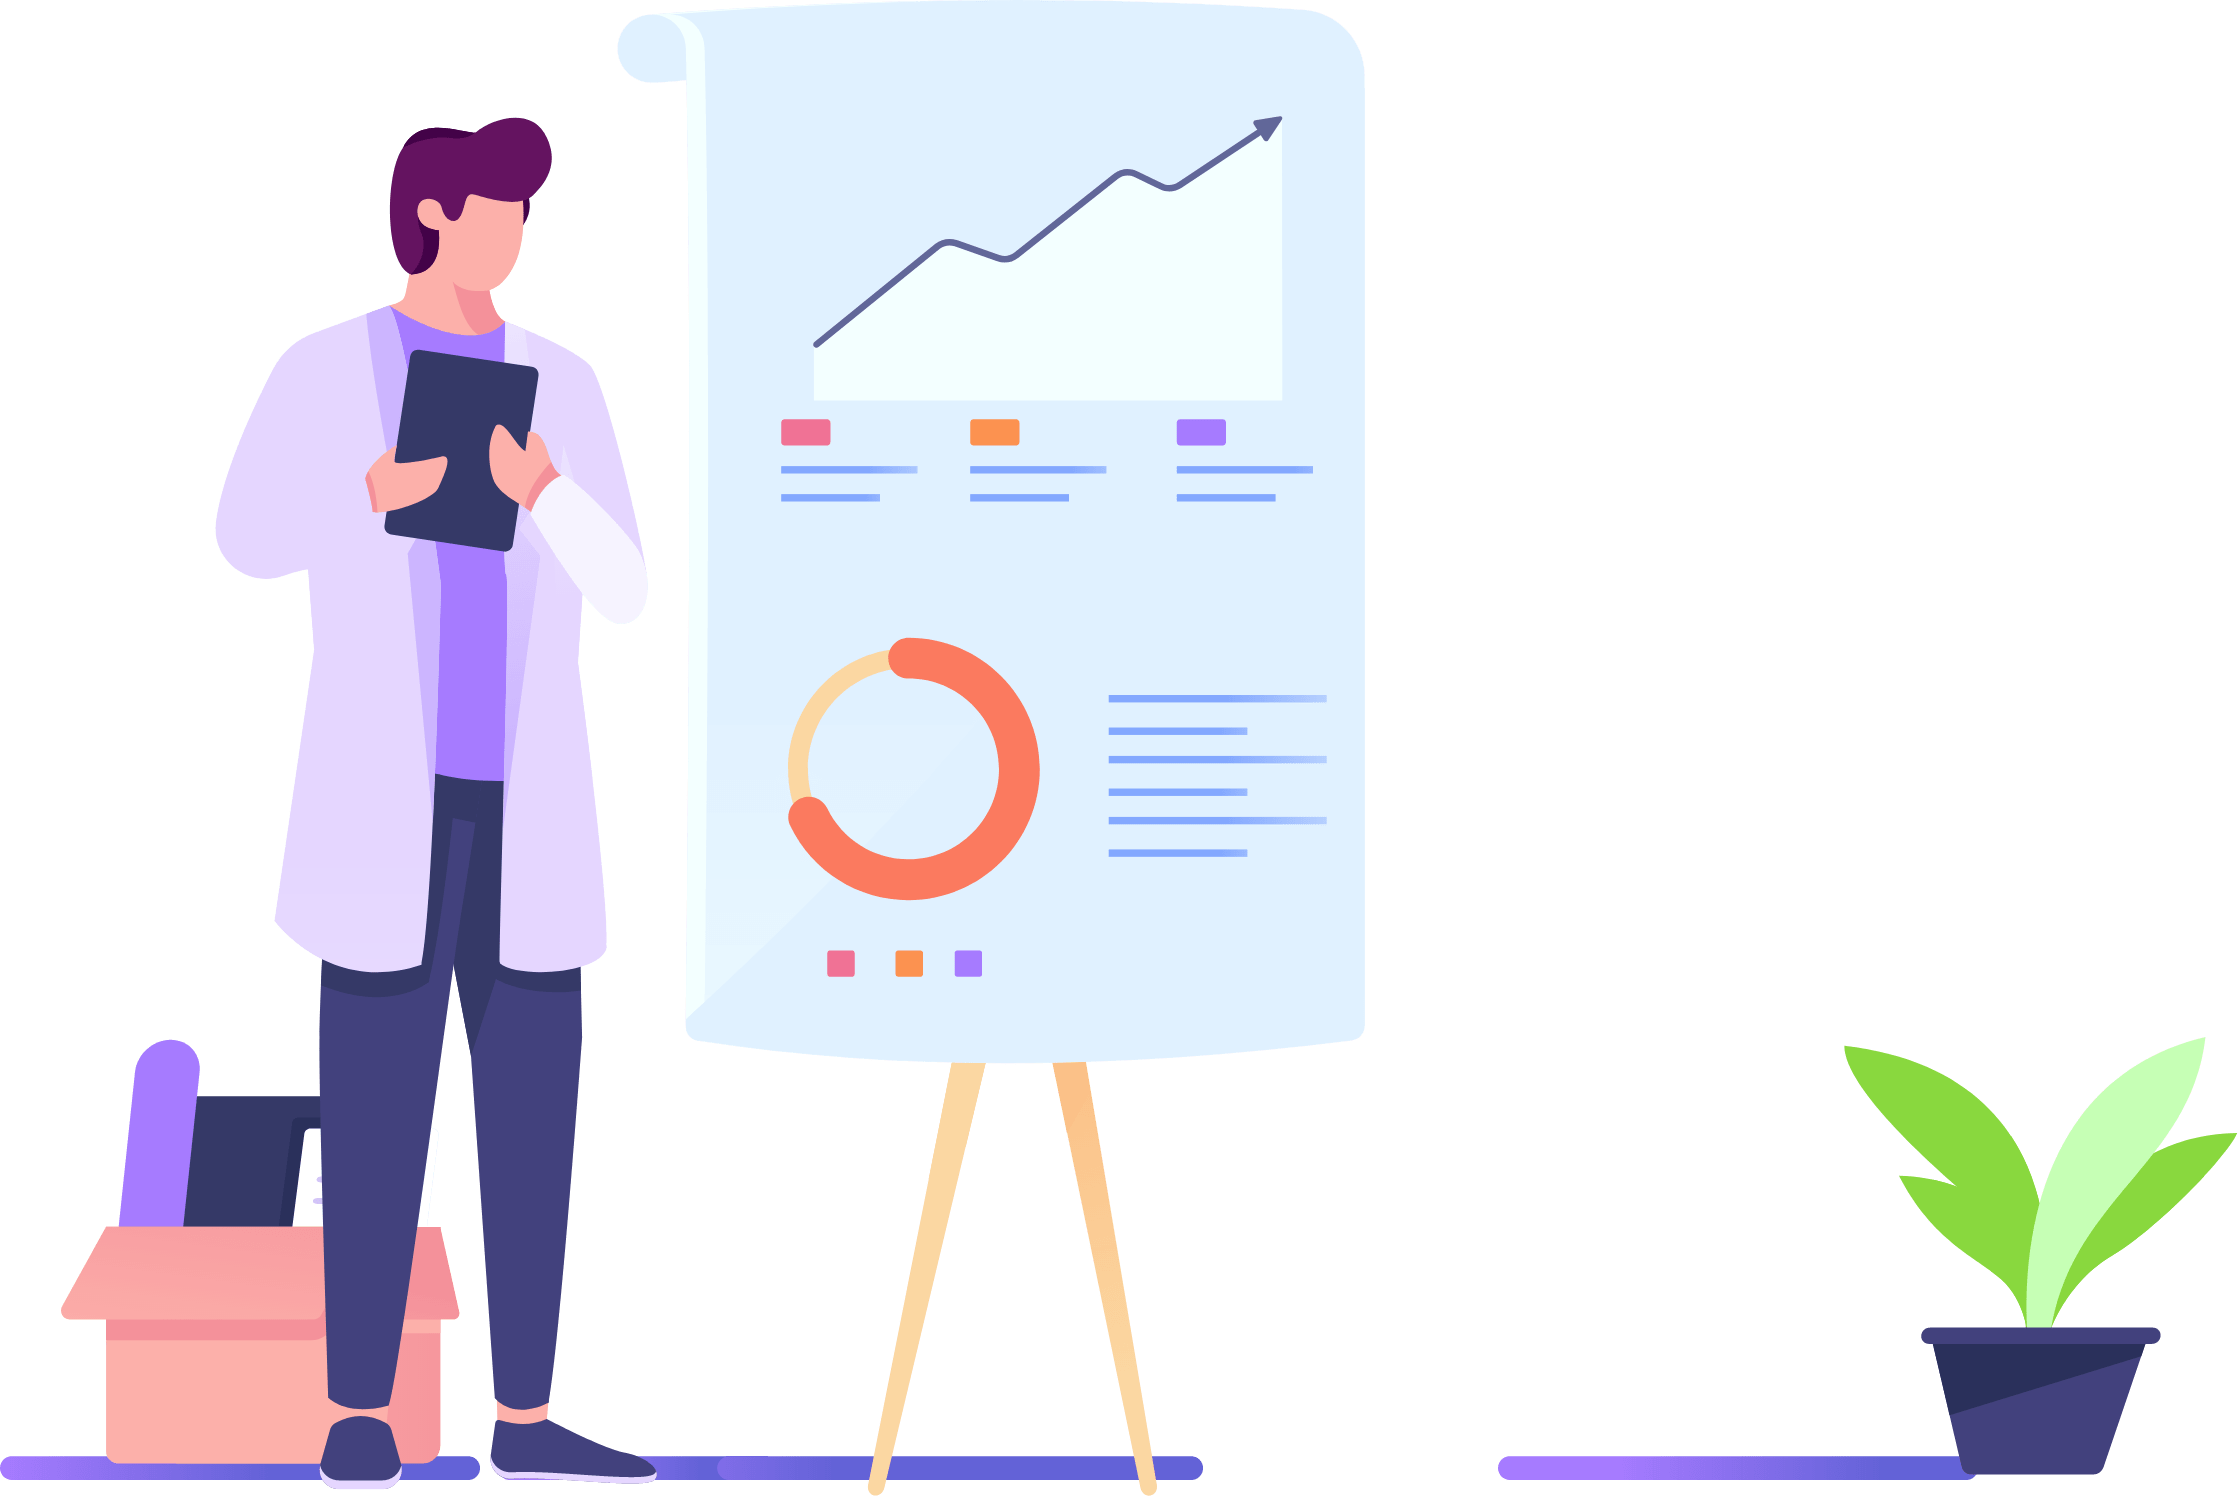
Data visualization is the representation of data through use of common graphics, such as charts, plots, infographics and even animations.

It is a process of collecting and storing data from various sources into a centralized repository, making it easier to analyze and generate insights for business decision-making.

Data logging is the process of recording data, typically over time, for analysis and future reference.

Data analytics is the process of examining large datasets to uncover patterns, trends, and insights that can inform decision-making.

Data migration is the process of moving digital data from one location, format, or system to another.


Real-time research and data analysis involves collecting and analyzing data as it’s generated, enabling immediate insights and actions. This contrasts with traditional batch processing, which waits for data to accumulate before analysis. Real-time analytics is crucial for time-sensitive issues and operational decisions.

WhatsApp us